Using USPS Data to Understand Population Trends

- Population trends are an important factor in estimating future housing prices.
- USPS change of address data has the potential to be a more timely data source for tracking population migration compared to Census Data.
- In Maine, both urban and rural areas have experienced higher rates of migration out from 2019 to 2022.
- Southern Maine saw a higher influx of people migrating into the area.
Economic and population growth often go hand in hand. For instance, when the working-age population increases, it tends to boost economic activities, such as housing construction. Research has also shown that housing prices tend to rise with a growing population and fall when population declines, although at a faster pace. At Upwardly, we employ machine learning to develop models that help us estimate future home prices. Therefore, it’s crucial to know how to incorporate population trends correctly into our machine learning models to achieve our goal of assisting aspiring homeowners to realize their dream of owning a home.
Looking at Maine as an example, the state has seen modest growth in both real GDP and population over the past two decades. Additionally, the population is graying and older than most other states in the country, according to data from the US Census Bureau.
Maine Population and Real GDP from 2000 to 2020
| 2000 | 2010 | 2020 | |
|---|---|---|---|
| Total Population | 1,274,923 | 1,328,361 | 1,362,359 |
| Population % Change | – | +4.2% | +2.6% |
| Median Age | 38.6 | 42.7 | 44.8 |
| Real GDP | $48.5B | $54.3B | $59.9B |
| GDP % Change | – | +12.0% | +10.3% |
Source: US Census Bureau, Federal Reserve
US Census data is a valuable source of information, providing detailed data down to zip code equivalent areas. However, Census data is not updated frequently, as it is only available once every ten years. Sometimes, Census estimates are available, but they lack granularity. For instance, how did the population of Maine change during the pandemic? Are there other data sources that can be utilized as a proxy for Census data? One potential alternative is the USPS change of address (COA) data, which offers insights into the number of requests to permanently change an address to and away from specific zip codes.
To validate if USPS COA data can serve as a reliable alternative, it will need to be compared with available population figures. The total number of change of address requests for Maine from 2019 to 2022 shows that more than 10 thousand addresses were changed away (outbound) from Maine than into (inbound) Maine. However, in 2020, during the pandemic, there were over 3 thousand inbounds into Maine, aligning with news reports of people moving to Maine during that time. In 2021 when shelter-in-place restrictions were lifted in Maine, the outflow from the state gradually increased.
Total Permanent Change of Address Requests Into/From Maine
| 2019 | 2020 | 2021 | 2022 | Net | |
|---|---|---|---|---|---|
| # of COA | -7329 | 3099 | -850 | -5018 | -10098 |
Source: USPS. A positive number indicates COA requests into, while a negative number shows requests away from Maine.
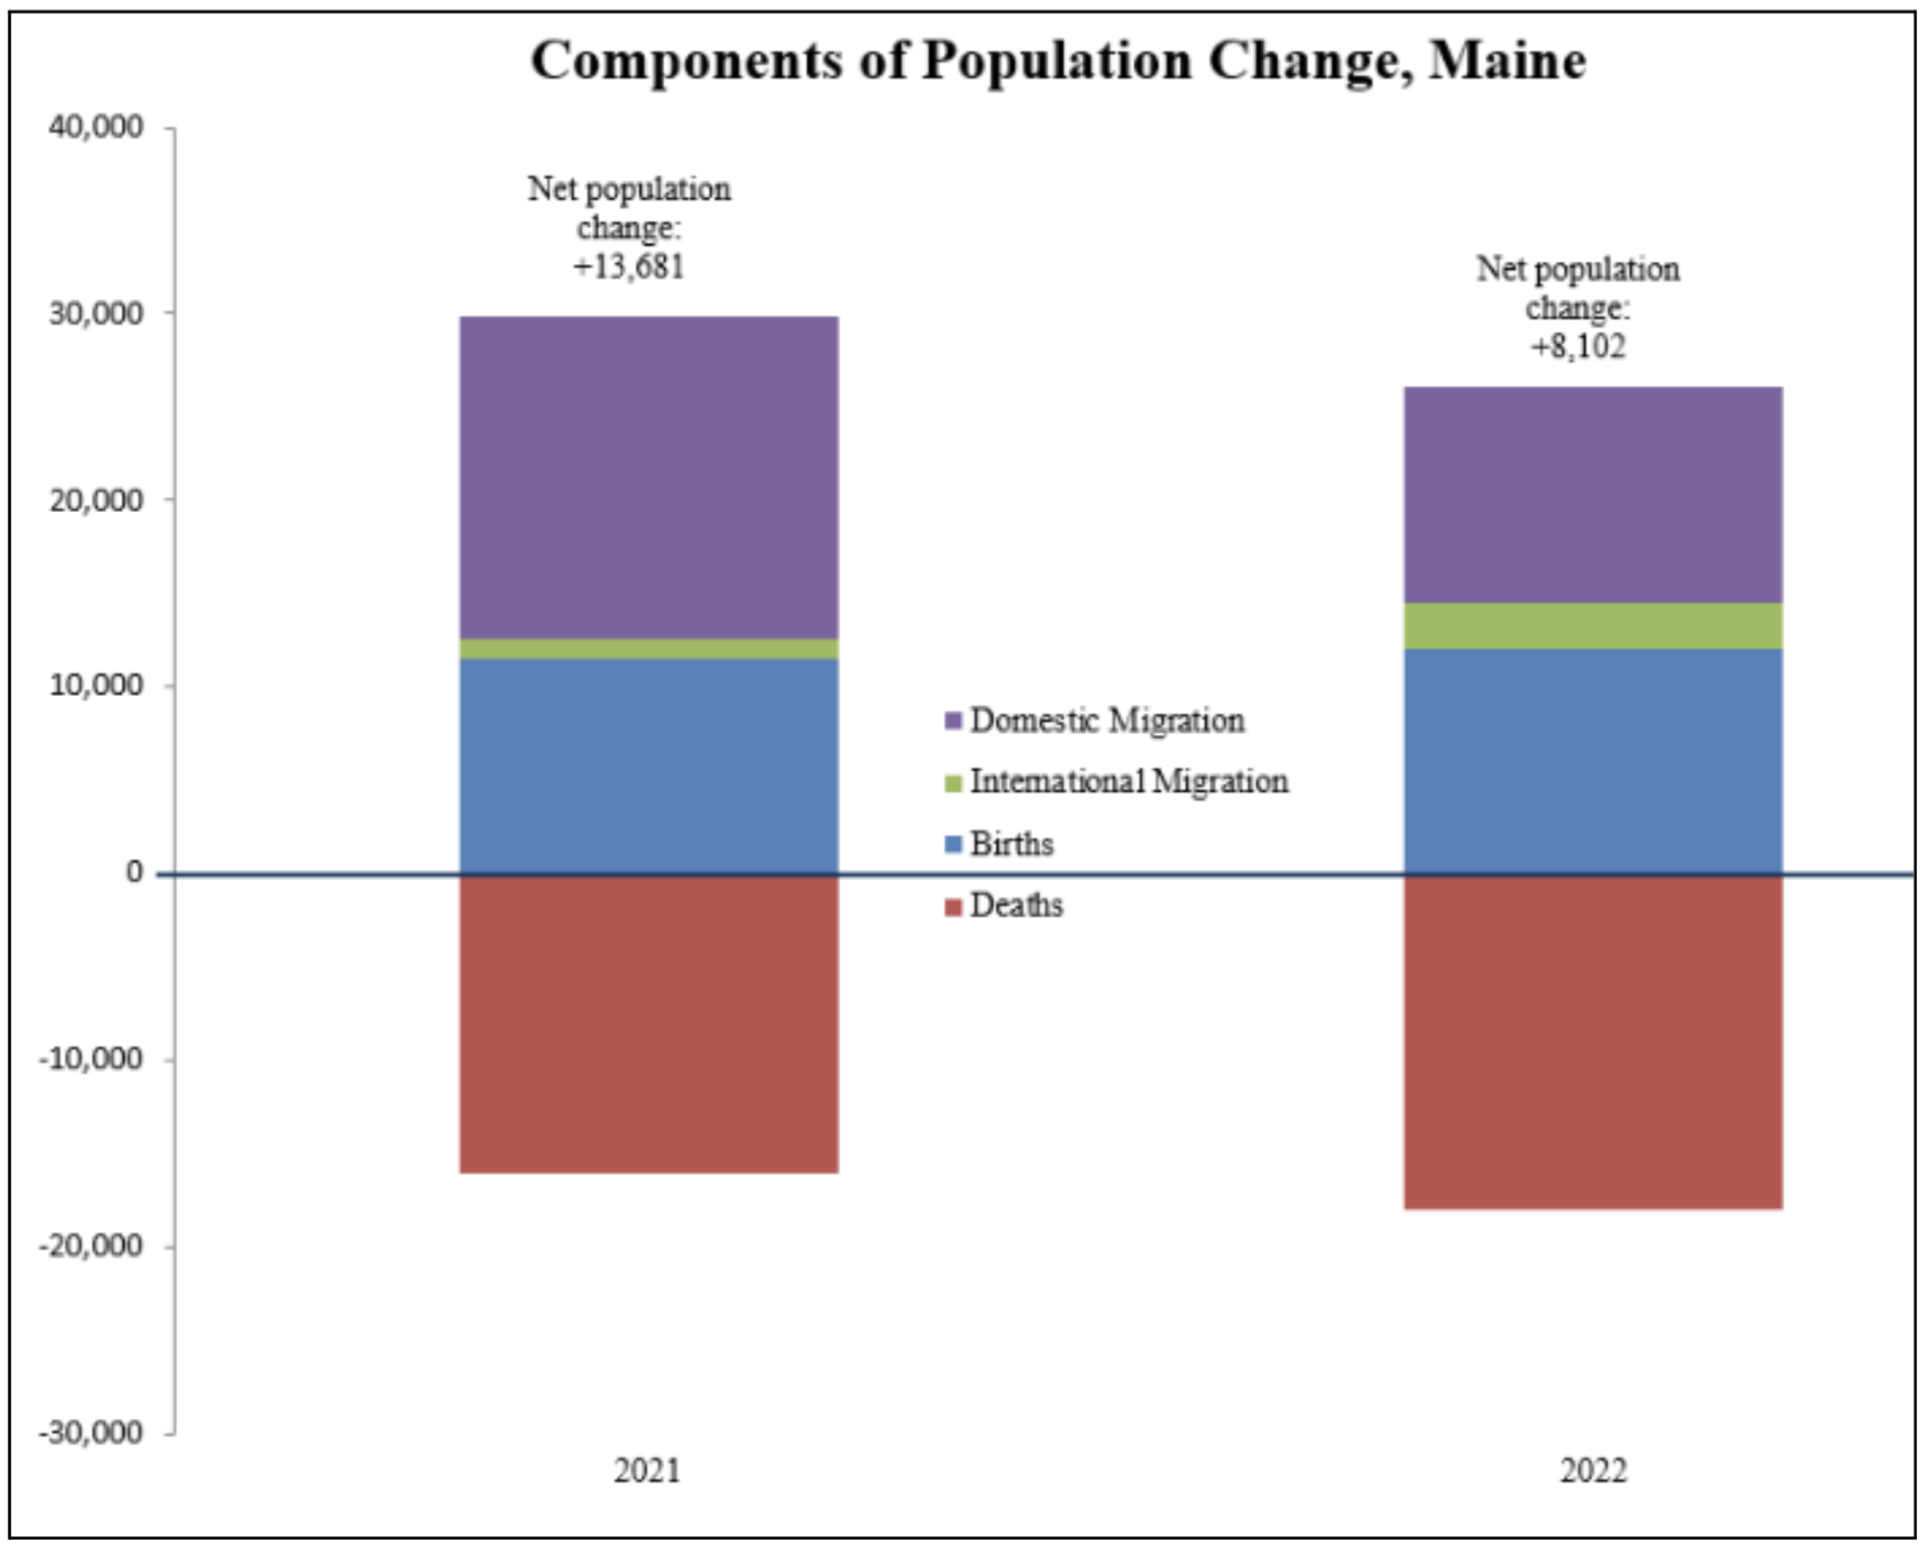
The US Census Bureau estimated that Maine’s population grew by over 13 thousand people in 2021 and over 8 thousand in 2022. There seems to be some correlation between the two data sources with a few exceptions. It’s important to note that USPS COA data better reflects migration but not changes in population due to births and deaths. Additionally, the USPS COA data could serve as a leading indicator of population trend compared to US Census estimates.

Source: US Census Bureau, Population Estimates Program
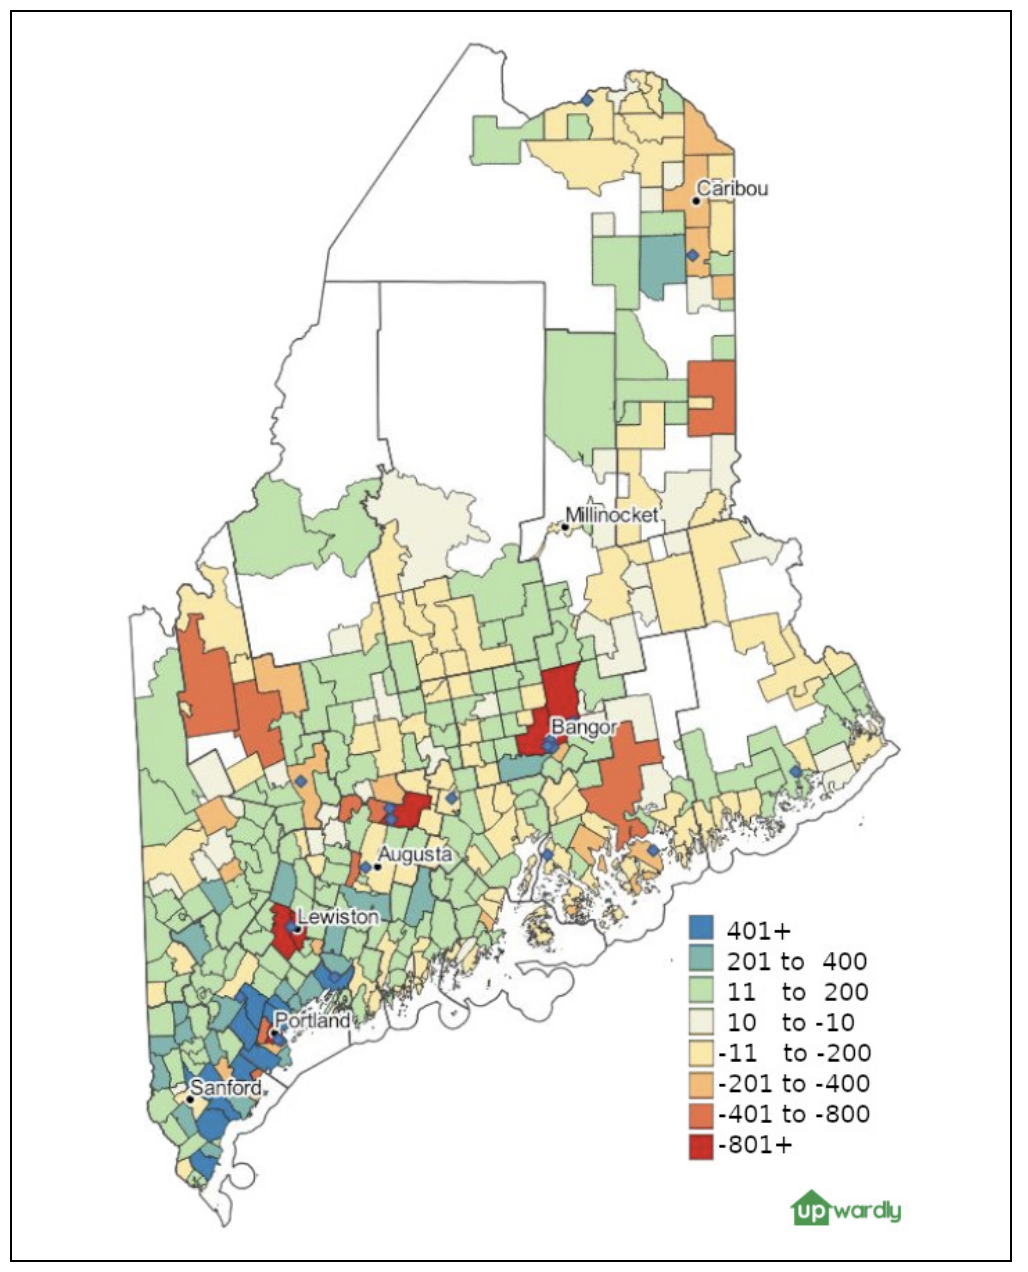
On a more detailed level, when the total number of COA requests per zip code is mapped out, certain patterns become visible
- More inbounds are concentrated along Interstate 95 in southern Maine and the surrounding Portland areas.
- Urban areas, like Portland, Lewiston-Auburn, Bangor, and Waterville, have significant levels of outbounds.
- Northern and rural areas of Maine have high numbers of outbounds.
Net Number of Change of Address Requests by Zip Code from 2019 to 2022

Source: USPS. A positive number indicates inbound, while a negative number shows outbound.
These findings are consistent with Maine’s population projections for 2025 and 2030. While the population outlook report advises caution regarding interpreting population declines in urban areas due to methodology, USPS COA data showing outflows from cities align with Maine’s own outlook for cities.
Maine Population Outlook 2020 to 2030
| Population of Maine’s five largest cities | ||||
| 2020 (Historical) | 2025 | 2030 | 2020 – 2030 | |
|---|---|---|---|---|
| Portland | 68,408 | 66,825 | 65,536 | |
| Lewiston | 37,121 | 36,574 | 36,838 | |
| Bangor | 31,753 | 31,354 | 31,286 | |
| South Portland | 26,498 | 26,236 | 26,116 | |
| Auburn | 24,061 | 24,636 | 25,535 | |
| Five year percent change | ||||
| Portland | -2.31% | -1.93% | -4.20% | |
| Lewiston | -1.47% | 0.72% | -1.47% | |
| Bangor | -1.26% | -0.22% | -1.47% | |
| South Portland | -0.99% | -0.46% | -1.44% | |
| Auburn | 2.39% | 3.65% | 6.13% | |
Source: Maine.gov, Maine Population Outlook 2020 to 2030
Another observation is that urban areas with more outbound requests often have universities and colleges located in or near their zip codes, as indicated by blue diamonds in the illustration above. The assumption is that when college students first enroll, most do not forward their mail from their parents’ home to their college address. However, upon graduation, most update their mail to their new address. This imbalance of outgoing requests versus incoming requests is also observed among immigrants, especially refugees. When they initially arrive in Maine from overseas, most are resettled in the state’s largest cities and are not reflected in USPS inbound COA requests. However, once they are settled, they typically update their mail forwarding information when they decide to move elsewhere. This contributes to a higher number of outbound requests compared to inbound ones. Maine is anticipating the need for at least 75 thousand new workers by 2029 to address its aging population, and immigration is a key component of that strategy.
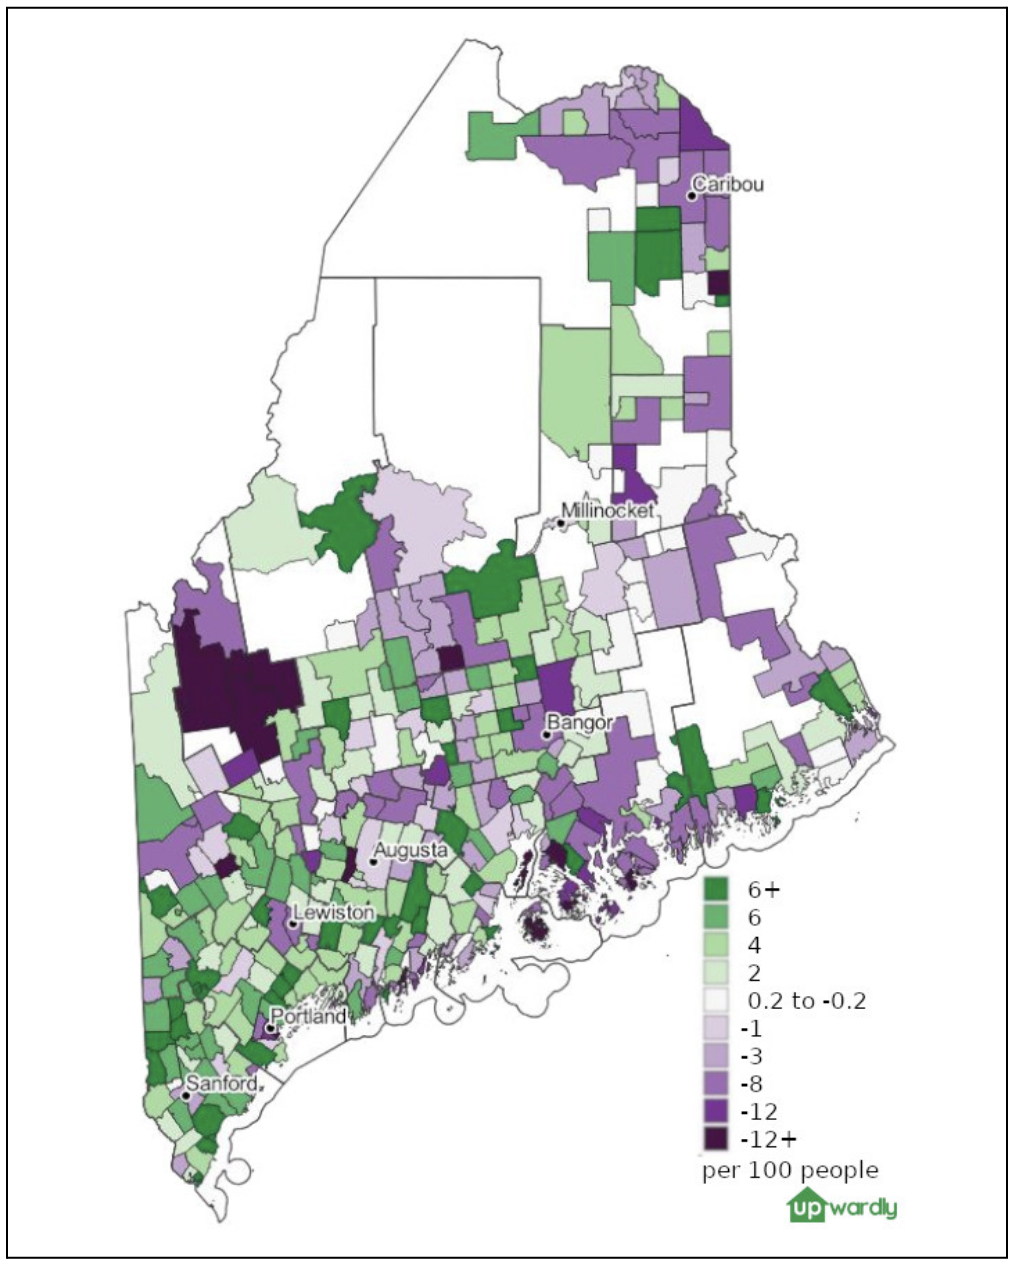
Finally, it’s essential to analyze USPS COA data on a per capita basis, as it offers an apples to apples comparison by zip code. The following map illustrates the net change of address requests from 2019 to 2022 per 100 people by zip code. The zip codes with outbound requests are more pronounced in magnitude, particularly in rural zip codes. For example, the outbound migrations for Franklin County are more stark. In Southern Maine, the inbound migration is spread out unevenly across the region.
Change of Address Requests Per 100 People by Zip Codes from 2019 to 2022

Source: USPS and US Census Bureau
Overall, USPS COA data is a valuable proxy for population trends, especially related to migration, but it does not provide insights into population changes due to births and deaths. Census estimates and data can complement this information. If considering the use of USPS COA data for any machine learning models, additional factors and data, such as college students enrollment and immigrants, should be considered. Beyond population data, other factors should also be considered with building home value prediction models, such as growth of housing supply. Lastly, it is essential to re-evaluate whether the assumptions made for Maine are applicable to other states and regions.


